

Skyscrapers touch the sunset sky. Type reads: Zacks Investment Management Mitch on the Markets Portfolio Manager Investing Insights

This Rate Hike Probably Won’t be the Last

Why This Rate Hike Probably Won’t Be the Last

When Federal Reserve Chairman Kevin Warsh was appointed, much of the market concern centered around whether he would push too hard for monetary easing—at a time when inflation was above target and the economy was growing steadily.

What a difference a few months of hot inflation can make.

August CPI showed prices rising 0.4% month-over-month and 3.4% year-over-year, and the Fed’s own September projections now put 2026 PCE inflation at 3.7% and core PCE inflation at 3.4%, both well above its 2% target.1

CPI (blue line) and the PCE Price Index (Green Line) Have Been Pressured Higher in 2026
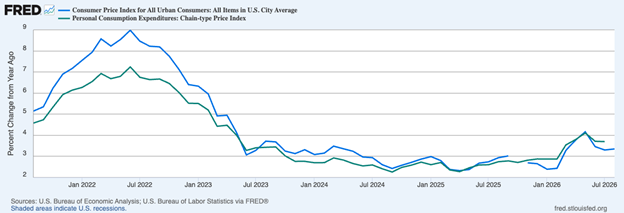
Source: Federal Reserve Bank of St. Louis2

What Hotter Inflation and Shifting Fed Policy Could Mean for Your Portfolio

Inflation continues to run hotter than expected, raising questions about how the Federal Reserve may respond and what higher interest rates could mean for investors.

Our latest September Stock Market Outlook Report³ examines how persistent inflation and changing expectations for Fed policy could affect the markets and your portfolio.

Inside, you’ll learn:

  • Asset allocation guidelines for today’s market environment
  • Expert forecasts for inflation, rates, and economic trends
  • Industry tables and rankings to help you spot opportunities
  • Buy-side and sell-side consensus insights at a glance
  • And much more!

Claim your complimentary copy of the report to learn how persistent inflation and shifting Fed policy could affect your portfolio in the months ahead.

IT’S FREE. Download our September Stock Market Outlook Report3

I want to be fair in making the point that the numbers do not suggest inflation is spiraling out of control, especially given the outsized impact of higher energy prices. But we’re certainly seeing an end to the downward trajectory that started in the summer of 2022, with recent price pressures being enough to motivate all 12 of the Fed’s voting members to push rates higher.

History tells us we should expect more hikes from here.

Federal Reserve rate changes tend to be serially correlated, meaning policy moves often come in sequences rather than isolated steps. Looking at actual changes in the federal funds target since 2003, there have been 60 rate changes. On the 59 occasions when one change was eventually followed by another, 52 of them—or roughly 88%—moved in the same direction as the prior change.4 In other words, a hike is almost always followed by another hike, with the same going for cuts.

The individual cycles make the pattern easier to see. The Fed raised rates 17 consecutive times from 2004 through 2006. It then delivered 11 hikes across 2022 and 2023. More recently, the Fed cut rates six consecutive times across 2024 and 2025 before reversing direction last week. This serial correlation is sometimes referred to as “interest-rate smoothing,” with central banks generally preferring to adjust policy incrementally as they receive new information about inflation and growth—rather than making one large move and immediately reversing course.

The Fed’s own projections point in the same direction today. Following this week’s increase, the median policymaker projection puts the federal funds rate at 4.1% at year-end, compared with the current midpoint of 3.875%. 16 of 18 policymakers expect at least one additional increase before year-end.

For investors, the big picture shows us a world where financial conditions are gradually being tightened. The European Central Bank and Bank of Japan have recently raised rates, while the Bank of England has adopted a more hawkish posture as energy prices and inflation remain elevated. It looks to me like a renewed global tightening cycle, which I think could have implications for equity market volatility (as I wrote about recently).

It’s a trend worth watching closely, though I expect this tightening cycle to be far less aggressive than what investors experienced in 2022 and 2023. In other words, not enough to derail the bull market. The larger questions remain whether inflation continues to moderate, whether economic and earnings growth hold up, and whether tighter policy eventually begins to materially weaken demand. When I zoom out and take it all into consideration, I don’t think two or three quarter-point hikes are meaningful enough to materially change the earnings or economic backdrop on their own.

Bottom Line for Investors

This week’s quarter-point rate hike was widely expected, and I do not think investors should overhaul portfolios because the federal funds rate moved 25 basis points higher. The more interesting signal is the direction of policy. Fed rate changes have historically tended to come in sequences, the central bank’s own projections point to additional tightening, and other major central banks are confronting many of the same inflation pressures. It’s something to watch, but probably not enough to fundamentally alter the investment landscape, in my view.

The final takeaway that I think deserves attention is the idea that pressure could/would compromise Federal Reserve independence. In my view, the rate hike decision provides a useful piece of evidence in the other direction. With midterm elections approaching and the administration openly favoring lower borrowing costs, the Fed still voted unanimously to raise rates in response to inflation. That looks like a central bank responding to economic data, not political pressure. This point becomes even more salient if the Fed decides to raise rates again from here, which I believe will be the case.

As inflation and monetary policy continue to shape the investment landscape, staying focused on the data will be essential. Download our latest September Stock Market Outlook Report5 for a closer look at the forces driving today’s market—and what they could mean for your portfolio.

Inside, you’ll learn:

  • Asset allocation guidelines for today’s market environment
  • Expert forecasts for inflation, rates, and economic trends
  • Industry tables and rankings to help you spot opportunities
  • Buy-side and sell-side consensus insights at a glance
  • And much more!

If you have $500,000 or more to invest, claim your complimentary copy of the report and see how shifting market trends could influence opportunities in the months ahead.

‍

‍

‍REFERENCED ARTICLES

1 Federal Reserve. September 16, 2026. Board of Governors of the Federal Reserve System.

2 FRED Fred Economic Data. September 11, 2026. Consumer Price Index for All Urban Consumers: All Items in U.S. City Average

3 Zacks Investment Management reserves the right to amend the terms or rescind the free Stock Market Outlook Report offer at any time and for any reason at its discretion.

4 Federal Reserve. September 16, 2026. Board of Governors of the Federal Reserve System.

5 Zacks Investment Management reserves the right to amend the terms or rescind the free Stock Market Outlook Report offer at any time and for any reason at its discretion.

The AI Trade Has a Borrowing Problem

It was a rough start to the fourth quarter for Technology stocks.

Read More
Is the 2024 Concentration Scare Back?

Zacks explores why strong earnings beyond big tech may ease concerns about concentrated market gains and reinforce the value of diversification.

Read More
Can Stocks Handle 5% Yields

Higher bond yields have raised concerns about borrowing costs and stock prices. Yet major U.S. stock indices remain near all-time highs. What could explain this, and what should investors watch next?

Read More
The Energy Price Nobody’s Watching: $6.53

With so much attention focused on crude oil and gasoline prices, the financial media—and by extension, many investors—may be overlooking another energy cost with even broader economic reach: diesel prices.

Read More
Bond Market Signals to Watch

The Bond Market Is Sending a Message

Read More
It’s Not Just the Mag 7 Driving Market Performance

Why Equity Investors are Actively Rotating Capital

Read More
The U.S. Just Hit $40 Trillion in Debt

The U.S. national debt officially crossed the $40 trillion mark.

Read More
This Rate Hike Probably Won’t be the Last

What a difference a few months of hot inflation can make.

Read More
Why the Market Got Choppy This Week

After a strong second quarter when stocks rebounded sharply from war- and energy-driven volatility, equity and fixed income markets have settled into a more unsettled holding pattern.

Read More
With Households Feeling Pressure, why is the Stock Market Booming?

According to the widely watched University of Michigan Consumer Sentiment Index, Americans are not feeling good about the economy.

Read More
Fed Rate Cut Hopes Dwindle as New Data Changes Outlook

For much of the past year, the market debate has centered on when the Fed would resume cutting interest rates.

Read More
Three Scenarios for Oil Prices after Peace Talks

With a 60-day ceasefire in effect and the U.S. and Iran holding peace talks, oil prices have moved meaningfully lower from their wartime highs.

Read More
Investing in 250 Years of American Innovation

As readers celebrate the July 4 holiday with family, we’re reminded that for nearly 250 years, the United States has been an engine of invention, innovation, and growth.

Read More
Is the Stock Market Rally Built to Last?

The stock market faced meaningful stress earlier this year, tied in part to the war in Iran and the surge in energy prices that followed. But the pressure didn’t last long.

Read More
Small Cap Outperformance Signals Broadening Market Rally

The Russell 2000 index of small-cap stocks has outperformed the S&P 500 index in the second quarter and over the past year, by a fairly significant margin in both periods.

Read More
What the IPO Boom Says About Risk and Sentiment

2026 is on pace to be a record year for U.S. IPOs, with proceeds already nearing the full-year high set in 2021, but the surge also raises questions about stretched valuations and a shifting supply-demand balance in equity markets.

Read More

Past performance is no guarantee of future results. Inherent in any investment is the potential for loss.  

Zacks Investment Management, Inc. is a wholly-owned subsidiary of Zacks Investment Research. Zacks Investment Management is an independent Registered Investment Advisory firm and acts as an investment manager for individuals and institutions. Zacks Investment Research is a provider of earnings data and other financial data to institutions and to individuals.

This material is being provided for informational purposes only and nothing herein constitutes investment, legal, accounting or tax advice, or a recommendation to buy, sell or hold a security. Do not act or rely upon the information and advice given in this publication without seeking the services of competent and professional legal, tax, or accounting counsel. Publication and distribution of this article is not intended to create, and the information contained herein does not constitute, an attorney-client relationship. No recommendation or advice is being given as to whether any investment or strategy is suitable for a particular investor. It should not be assumed that any investments in securities, companies, sectors or markets identified and described were or will be profitable. All information is current as of the date of herein and is subject to change without notice. Any views or opinions expressed may not reflect those of the firm as a whole.

Any projections, targets, or estimates in this report are forward looking statements and are based on the firm’s research, analysis, and assumptions. Due to rapidly changing market conditions and the complexity of investment decisions, supplemental information and other sources may be required to make informed investment decisions based on your individual investment objectives and suitability specifications. All expressions of opinions are subject to change without notice. Clients should seek financial advice regarding the appropriateness of investing in any security or investment strategy discussed in this presentation.

Certain economic and market information contained herein has been obtained from published sources prepared by other parties. Zacks Investment Management does not assume any responsibility for the accuracy or completeness of such information. Further, no third party has assumed responsibility for independently verifying the information contained herein and accordingly no such persons make any representations with respect to the accuracy, completeness or reasonableness of the information provided herein. Unless otherwise indicated, market analysis and conclusions are based upon opinions or assumptions that Zacks Investment Management considers to be reasonable.

Any investment inherently involves a high degree of risk, beyond any specific risks discussed herein.

It is not possible to invest directly in an index. Investors pursuing a strategy similar to an index may experience higher or lower returns, which will be reduced by fees and expenses.

The ICE U.S. Dollar Index measures the value of the U.S. Dollar against a basket of currencies of the top six trading partners of the United States, as measured in 1973: the Euro zone, Japan, the United Kingdom, Canada, Sweden, and Switzerland. An investor cannot directly invest in an index. The volatility of the benchmark may be materially different from the individual performance obtained by a specific investor.

Zacks Investment Management, Inc. is a wholly-owned subsidiary of Zacks Investment Research. Zacks Investment Management is an independent Registered Investment Advisory firm that acts as an investment manager for individuals and institutions. Zacks Investment Research is a provider of earnings data and other financial data to institutions and to individuals.  

This material is being provided for informational purposes only and nothing herein constitutes investment, legal, accounting or tax advice, or a recommendation to buy, sell or hold a security. Do not act or rely upon the information and advice given in this publication without seeking the services of competent and professional legal, tax, or accounting counsel. Publication and distribution of this article is not intended to create, and the information contained herein does not constitute, an attorney-client relationship. No recommendation or advice is being given as to whether any investment or strategy is suitable for a particular investor. It should not be assumed that any investments in securities, companies, sectors or markets identified and described were or will be profitable. All information is current as of the date of herein and is subject to change without notice. Any views or opinions expressed may not reflect those of the firm as a whole.

Any projections, targets, or estimates in this report are forward looking statements and are based on the firm’s research, analysis, and assumptions. Due to rapidly changing market conditions and the complexity of investment decisions, supplemental information and other sources may be required to make informed investment decisions based on your individual investment objectives and suitability specifications. All expressions of opinions are subject to change without notice. Clients should seek financial advice regarding the appropriateness of investing in any security or investment strategy discussed in this presentation.  

Certain economic and market information contained herein has been obtained from published sources prepared by other parties. Zacks Investment Management does not assume any responsibility for the accuracy or completeness of such information. Further, no third party has assumed responsibility for independently verifying the information contained herein and accordingly no such persons make any representations with respect to the accuracy, completeness or reasonableness of the information provided herein. Unless otherwise indicated, market analysis and conclusions are based upon opinions or assumptions that Zacks Investment Management considers to be reasonable. Any investment inherently involves a high degree of risk, beyond any specific risks discussed herein.

The S&P 500 Index is a well-known, unmanaged index of the prices of 500 large-company common stocks, mainly blue-chip stocks, selected by Standard & Poor’s. The S&P 500 Index assumes reinvestment of dividends but does not reflect advisory fees. The volatility of the benchmark may be materially different from the individual performance obtained by a specific investor. An investor cannot invest directly in an index.

The Russell 1000 Growth Index is a well-known, unmanaged index of the prices of 1000 large-company growth common stocks selected by Russell. The Russell 1000 Growth Index assumes reinvestment of dividends but does not reflect advisory fees. An investor cannot invest directly in an index. The volatility of the benchmark may be materially different from the individual performance obtained by a specific investor.

Nasdaq Composite Index is the market capitalization-weighted index of over 3,300 common equities listed on the Nasdaq stock exchange. The types of securities in the index include American depositary receipts, common stocks, real estate investment trusts (REITs) and tracking stocks, as well as limited partnership interests. The index includes all Nasdaq-listed stocks that are not derivatives, preferred shares, funds, exchange-traded funds (ETFs) or debenture securities. An investor cannot invest directly in an index. The volatility of the benchmark may be materially different from the individual performance obtained by a specific investor.

The Dow Jones Industrial Average measures the daily stock market movements of 30 U.S. publicly-traded companies listed on the NASDAQ or the New York Stock Exchange (NYSE). The 30 publicly-owned companies are considered leaders in the United States economy. An investor cannot directly invest in an index. The volatility of the benchmark may be materially different from the individual performance obtained by a specific investor.

The Bloomberg Global Aggregate Index is a flagship measure of global investment grade debt from twenty-four local currency markets. This multi-currency benchmark includes treasury, government-related, corporate and securitized fixed-rate bonds from both developed and emerging markets issuers. An investor cannot invest directly in an index. The volatility of the benchmark may be materially different from the individual performance obtained by a specific investor.

The ICE Exchange-Listed Fixed & Adjustable Rate Preferred Securities Index is a modified market capitalization weighted index composed of preferred stock and securities that are functionally equivalent to preferred stock including, but not limited to, depositary preferred securities, perpetual subordinated debt and certain securities issued by banks and other financial institutions that are eligible for capital treatment with respect to such instruments akin to that received for issuance of straight preferred stock. An investor cannot invest directly in an index. The volatility of the benchmark may be materially different from the individual performance obtained by a specific investor.  

The CBOE Volatility Index (VIX) is a calculation designed to produce a measure of constant, 30-day expected volatility of the U.S. stock market, derived from real-time, mid-quote prices of S&P 500 Index call and put options. On a global basis, it is one of the most recognized measures of volatility -- widely reported by financial media and closely followed by a variety of market participants as a daily market indicator. The volatility of the benchmark may be materially different from the individual performance obtained by a specific investor. An investor cannot invest directly in an index. The NASDAQ-100 Index includes 100 of the largest domestic and international non-financial companies listed on The NASDAQ Stock Market based on market capitalization. The Index reflects companies across major industry groups including computer hardware and software, telecommunications, retail/wholesale trade and biotechnology. Index composition is reviewed on an annual basis in December. An investor cannot invest directly in an index.

Investment Planners, Inc. Disclosure

Disclosure: Securities and investment advice offered through Investment Planners, Inc. (Member FINRA/SIPC) and IPI Wealth Management, Inc., 226 W. Eldorado St. Decatur, IL 62522. 217-425-6340. Galeon Asset Management, LLC is independently owned/operated and is not affiliated with Investment Planners, Inc. or IPI Wealth Management, Inc.

Discover The Galeon Difference.

Your dreams. Your legacy. Your terms.

Get Started Today