
Skyscrapers touch the sunset sky. Type reads: Zacks Investment Management Mitch on the Markets Portfolio Manager Investing Insights

The AI Trade Has a Borrowing Problem

How Your Portfolio Should Respond to Rising AI Borrowing Costs

It was a rough start to the fourth quarter for Technology stocks. In the week ending October 16, the Nasdaq Composite fell approximately 4.5%, as investors started to scrutinize borrowing costs associated with the AI infrastructure buildout.

In this week’s column, I’m going to reference specific companies to illustrate where some of the financing pressure was coming from. But please note, references to individual companies are for illustrative purposes only and are not recommendations to buy, sell, or hold any security.

The biggest company driving investor concern was CoreWeave, which provides cloud computing capacity for AI. The company had issued unsecured bonds in June with a 9.625% annual coupon, but by the end of last week, reports put yields on some of its bonds at roughly 15%–16%. Credit investors were demanding substantially greater compensation to own its debt. 1

The distinction between the coupon and market yield is important. Falling bond prices do not automatically increase interest payments on existing fixed-rate debt. They do, however, indicate the returns investors may require for future borrowing or refinancing.

CoreWeave’s quarterly results make this financing challenge tangible. Second-quarter revenue more than doubled to $2.58 billion, but the company reported $640 million in net interest expense and a $626 million net loss. Rising demand for CoreWeave’s services is coexisting with rising financing expense, which leaves less room for delays or disappointing returns.2

Over last weekend, Reuters reported that Anthropic was offering a yield exceeding 10% on a proposed $9 billion financing involving Blackstone funds, backed by five years of chip-lease payments. Anthropic is being held out as one of the most promising frontier labs, but 10% yields on $9 billion represents a substantial financing cost to carry as the investment generates returns.2

I think these financing risks warrant caution, particularly when a portfolio depends heavily on companies borrowing to fund rapid expansion. And even though it may seem like Technology is the only game in town, I think investors have a much wider range of businesses to consider—with different capital requirements and sources of profit. The latest earnings estimates give us a useful picture of those opportunities.

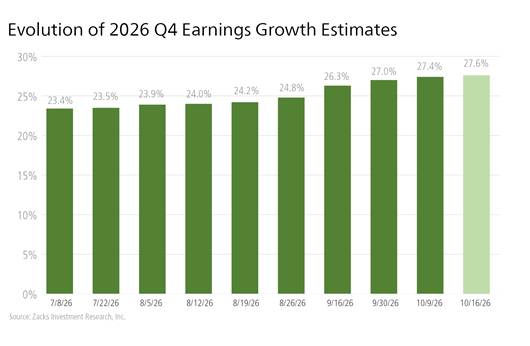
According to our colleagues at Zacks Investment Research, third-quarter S&P 500 earnings are expected to increase 24.6% year-over-year on 11.7% higher revenues. Removing Technology reduces expected earnings growth to 14.4%, but double-digit growth across the rest of the index is still an encouraging starting point.

The breadth is encouraging: 14 of the 16 Zacks sectors are expected to report positive earnings growth. And looking ahead, upward fourth-quarter revisions extend into Aerospace, Construction, Industrials, Finance, and Transportation. That gives investors evidence of improving profit expectations outside the companies at the center of the AI financing debate.

These are forecasts that incoming results will test, which we’ll of course be watching closely.
Valuations also differ substantially across the market. At the start of October, the equal-weight S&P 500 traded at approximately 15x expected earnings over the next 12 months, compared with about 19x for the traditional S&P 500 Index. That gap suggests investors can find stocks trading at more attractive valuations outside the market’s largest companies.

That leaves opportunities to evaluate growing businesses at more modest valuations. A lower multiple still requires scrutiny, but investors have a much wider set of choices than the handful of companies attracting the most headlines, in my view.

Going forward, the financing concerns deserve continued attention. A sustained reduction in AI investment could affect equipment suppliers and lenders beyond the borrowers themselves. I would become more concerned if those pressures began producing widespread earnings downgrades or making credit harder to obtain across unrelated industries. For now, the Zacks earnings outlook supports a broader search for opportunities. Investors can assess cash generation and valuations across sectors while keeping exposure to any single financing cycle (in this case, AI) in proportion.

Bottom Line for Investors

The recent selloff is a useful opportunity to examine how much of a portfolio depends on the same outcome. Several holdings can carry different company names while relying on the same capital-spending cycle.

In my view, diversification means giving a portfolio multiple ways to make progress. There is room to participate in AI, while also owning businesses with different customers, financing needs, and sources of profit. That flexibility becomes particularly valuable when one of the market’s most prominent growth themes faces a more demanding financial test, as we may be seeing now.

Disclosure

1 Reuters. October 16, 2026. “Private credit roundup: CoreWeave's debt stress tests private credit's AI financing boom.”

2 Zacks Investment Research. October 16, 2026. “Q3 Earnings Season Preview: Revenue Beats Lag, Multi-Sector Momentum Holds.”

‍

The AI Trade Has a Borrowing Problem

It was a rough start to the fourth quarter for Technology stocks.

Read More
Is the 2024 Concentration Scare Back?

Zacks explores why strong earnings beyond big tech may ease concerns about concentrated market gains and reinforce the value of diversification.

Read More
Can Stocks Handle 5% Yields

Higher bond yields have raised concerns about borrowing costs and stock prices. Yet major U.S. stock indices remain near all-time highs. What could explain this, and what should investors watch next?

Read More
The Energy Price Nobody’s Watching: $6.53

With so much attention focused on crude oil and gasoline prices, the financial media—and by extension, many investors—may be overlooking another energy cost with even broader economic reach: diesel prices.

Read More
Bond Market Signals to Watch

The Bond Market Is Sending a Message

Read More
It’s Not Just the Mag 7 Driving Market Performance

Why Equity Investors are Actively Rotating Capital

Read More
The U.S. Just Hit $40 Trillion in Debt

The U.S. national debt officially crossed the $40 trillion mark.

Read More
This Rate Hike Probably Won’t be the Last

What a difference a few months of hot inflation can make.

Read More
Why the Market Got Choppy This Week

After a strong second quarter when stocks rebounded sharply from war- and energy-driven volatility, equity and fixed income markets have settled into a more unsettled holding pattern.

Read More
With Households Feeling Pressure, why is the Stock Market Booming?

According to the widely watched University of Michigan Consumer Sentiment Index, Americans are not feeling good about the economy.

Read More
Fed Rate Cut Hopes Dwindle as New Data Changes Outlook

For much of the past year, the market debate has centered on when the Fed would resume cutting interest rates.

Read More
Three Scenarios for Oil Prices after Peace Talks

With a 60-day ceasefire in effect and the U.S. and Iran holding peace talks, oil prices have moved meaningfully lower from their wartime highs.

Read More
Investing in 250 Years of American Innovation

As readers celebrate the July 4 holiday with family, we’re reminded that for nearly 250 years, the United States has been an engine of invention, innovation, and growth.

Read More
Is the Stock Market Rally Built to Last?

The stock market faced meaningful stress earlier this year, tied in part to the war in Iran and the surge in energy prices that followed. But the pressure didn’t last long.

Read More
Small Cap Outperformance Signals Broadening Market Rally

The Russell 2000 index of small-cap stocks has outperformed the S&P 500 index in the second quarter and over the past year, by a fairly significant margin in both periods.

Read More
What the IPO Boom Says About Risk and Sentiment

2026 is on pace to be a record year for U.S. IPOs, with proceeds already nearing the full-year high set in 2021, but the surge also raises questions about stretched valuations and a shifting supply-demand balance in equity markets.

Read More

Past performance is no guarantee of future results. Inherent in any investment is the potential for loss.  

Zacks Investment Management, Inc. is a wholly-owned subsidiary of Zacks Investment Research. Zacks Investment Management is an independent Registered Investment Advisory firm and acts as an investment manager for individuals and institutions. Zacks Investment Research is a provider of earnings data and other financial data to institutions and to individuals.

This material is being provided for informational purposes only and nothing herein constitutes investment, legal, accounting or tax advice, or a recommendation to buy, sell or hold a security. Do not act or rely upon the information and advice given in this publication without seeking the services of competent and professional legal, tax, or accounting counsel. Publication and distribution of this article is not intended to create, and the information contained herein does not constitute, an attorney-client relationship. No recommendation or advice is being given as to whether any investment or strategy is suitable for a particular investor. It should not be assumed that any investments in securities, companies, sectors or markets identified and described were or will be profitable. All information is current as of the date of herein and is subject to change without notice. Any views or opinions expressed may not reflect those of the firm as a whole.

Any projections, targets, or estimates in this report are forward looking statements and are based on the firm’s research, analysis, and assumptions. Due to rapidly changing market conditions and the complexity of investment decisions, supplemental information and other sources may be required to make informed investment decisions based on your individual investment objectives and suitability specifications. All expressions of opinions are subject to change without notice. Clients should seek financial advice regarding the appropriateness of investing in any security or investment strategy discussed in this presentation.

Certain economic and market information contained herein has been obtained from published sources prepared by other parties. Zacks Investment Management does not assume any responsibility for the accuracy or completeness of such information. Further, no third party has assumed responsibility for independently verifying the information contained herein and accordingly no such persons make any representations with respect to the accuracy, completeness or reasonableness of the information provided herein. Unless otherwise indicated, market analysis and conclusions are based upon opinions or assumptions that Zacks Investment Management considers to be reasonable.

Any investment inherently involves a high degree of risk, beyond any specific risks discussed herein.

It is not possible to invest directly in an index. Investors pursuing a strategy similar to an index may experience higher or lower returns, which will be reduced by fees and expenses.

The ICE U.S. Dollar Index measures the value of the U.S. Dollar against a basket of currencies of the top six trading partners of the United States, as measured in 1973: the Euro zone, Japan, the United Kingdom, Canada, Sweden, and Switzerland. An investor cannot directly invest in an index. The volatility of the benchmark may be materially different from the individual performance obtained by a specific investor.

Zacks Investment Management, Inc. is a wholly-owned subsidiary of Zacks Investment Research. Zacks Investment Management is an independent Registered Investment Advisory firm that acts as an investment manager for individuals and institutions. Zacks Investment Research is a provider of earnings data and other financial data to institutions and to individuals.  

This material is being provided for informational purposes only and nothing herein constitutes investment, legal, accounting or tax advice, or a recommendation to buy, sell or hold a security. Do not act or rely upon the information and advice given in this publication without seeking the services of competent and professional legal, tax, or accounting counsel. Publication and distribution of this article is not intended to create, and the information contained herein does not constitute, an attorney-client relationship. No recommendation or advice is being given as to whether any investment or strategy is suitable for a particular investor. It should not be assumed that any investments in securities, companies, sectors or markets identified and described were or will be profitable. All information is current as of the date of herein and is subject to change without notice. Any views or opinions expressed may not reflect those of the firm as a whole.

Any projections, targets, or estimates in this report are forward looking statements and are based on the firm’s research, analysis, and assumptions. Due to rapidly changing market conditions and the complexity of investment decisions, supplemental information and other sources may be required to make informed investment decisions based on your individual investment objectives and suitability specifications. All expressions of opinions are subject to change without notice. Clients should seek financial advice regarding the appropriateness of investing in any security or investment strategy discussed in this presentation.  

Certain economic and market information contained herein has been obtained from published sources prepared by other parties. Zacks Investment Management does not assume any responsibility for the accuracy or completeness of such information. Further, no third party has assumed responsibility for independently verifying the information contained herein and accordingly no such persons make any representations with respect to the accuracy, completeness or reasonableness of the information provided herein. Unless otherwise indicated, market analysis and conclusions are based upon opinions or assumptions that Zacks Investment Management considers to be reasonable. Any investment inherently involves a high degree of risk, beyond any specific risks discussed herein.

The S&P 500 Index is a well-known, unmanaged index of the prices of 500 large-company common stocks, mainly blue-chip stocks, selected by Standard & Poor’s. The S&P 500 Index assumes reinvestment of dividends but does not reflect advisory fees. The volatility of the benchmark may be materially different from the individual performance obtained by a specific investor. An investor cannot invest directly in an index.

The Russell 1000 Growth Index is a well-known, unmanaged index of the prices of 1000 large-company growth common stocks selected by Russell. The Russell 1000 Growth Index assumes reinvestment of dividends but does not reflect advisory fees. An investor cannot invest directly in an index. The volatility of the benchmark may be materially different from the individual performance obtained by a specific investor.

Nasdaq Composite Index is the market capitalization-weighted index of over 3,300 common equities listed on the Nasdaq stock exchange. The types of securities in the index include American depositary receipts, common stocks, real estate investment trusts (REITs) and tracking stocks, as well as limited partnership interests. The index includes all Nasdaq-listed stocks that are not derivatives, preferred shares, funds, exchange-traded funds (ETFs) or debenture securities. An investor cannot invest directly in an index. The volatility of the benchmark may be materially different from the individual performance obtained by a specific investor.

The Dow Jones Industrial Average measures the daily stock market movements of 30 U.S. publicly-traded companies listed on the NASDAQ or the New York Stock Exchange (NYSE). The 30 publicly-owned companies are considered leaders in the United States economy. An investor cannot directly invest in an index. The volatility of the benchmark may be materially different from the individual performance obtained by a specific investor.

The Bloomberg Global Aggregate Index is a flagship measure of global investment grade debt from twenty-four local currency markets. This multi-currency benchmark includes treasury, government-related, corporate and securitized fixed-rate bonds from both developed and emerging markets issuers. An investor cannot invest directly in an index. The volatility of the benchmark may be materially different from the individual performance obtained by a specific investor.

The ICE Exchange-Listed Fixed & Adjustable Rate Preferred Securities Index is a modified market capitalization weighted index composed of preferred stock and securities that are functionally equivalent to preferred stock including, but not limited to, depositary preferred securities, perpetual subordinated debt and certain securities issued by banks and other financial institutions that are eligible for capital treatment with respect to such instruments akin to that received for issuance of straight preferred stock. An investor cannot invest directly in an index. The volatility of the benchmark may be materially different from the individual performance obtained by a specific investor.  

The CBOE Volatility Index (VIX) is a calculation designed to produce a measure of constant, 30-day expected volatility of the U.S. stock market, derived from real-time, mid-quote prices of S&P 500 Index call and put options. On a global basis, it is one of the most recognized measures of volatility -- widely reported by financial media and closely followed by a variety of market participants as a daily market indicator. The volatility of the benchmark may be materially different from the individual performance obtained by a specific investor. An investor cannot invest directly in an index. The NASDAQ-100 Index includes 100 of the largest domestic and international non-financial companies listed on The NASDAQ Stock Market based on market capitalization. The Index reflects companies across major industry groups including computer hardware and software, telecommunications, retail/wholesale trade and biotechnology. Index composition is reviewed on an annual basis in December. An investor cannot invest directly in an index.

Investment Planners, Inc. Disclosure

Disclosure: Securities and investment advice offered through Investment Planners, Inc. (Member FINRA/SIPC) and IPI Wealth Management, Inc., 226 W. Eldorado St. Decatur, IL 62522. 217-425-6340. Galeon Asset Management, LLC is independently owned/operated and is not affiliated with Investment Planners, Inc. or IPI Wealth Management, Inc.

Discover The Galeon Difference.

Your dreams. Your legacy. Your terms.

Get Started Today